
Evaluation
The registration results which are submitted are evaluated in four separate ways as follows:
Aligning the boundaries of the lungs correctly is one of the most fundamental expectations of an image registration algorithm. The lung boundary is easily defined in CT in most regions, with the notable exception of the mediastinal (central) region. We therefore restrict our analysis to the peripheral regions where the obvious density change between lung parenchyma and chest wall occurs.
The lungs in all images are segmented using an automatic algorithm from van Rikxoort et al. [1]. Lung segmentations are checked and altered manually where necessary. The lung boundary defined by the lung segmentations is extracted and a distance transform image is generated from the boundary image. The mediastinal region of the left lung is masked out by a sphere centred at the centre-of-mass of both lungs combined. The radius of this sphere is defined by the Euclidean distance from the centre-of-mass of both lungs combined to the centre-of-mass of the left lung. The mediastinal region of the right lung is masked out in a similar manner and all voxels within either sphere are excluded from further processing.
Next, points within 20mm of the lung boundary are marked, excluding those within 2mm of the boundary to allow for minor inaccuracies in the lung segmentation. Points inside and outside the lung boundaries are distinguished using the lung segmentation image and marked with different values v_in and v_out respectively. These markings constitute a reference standard for checking lung boundary alignment (see figure 2).
For each participant registration we receive the deformation field data. Using this data, we calculate for each point p_fixed marked with v_in or v_out in the fixed image which point p_reg in the moving image has been aligned with this location. If p_fixed is marked with v_in and p_reg is marked with v_out then a unit penalty is incurred. Similarly the reverse situation where p_fixed is marked with v_out and p_reg is marked with v_in also incurs a unit penalty.
For each registration of each scan pair the following statistics are calculated:
 |
| Figure 1: On the left the fixed (target) image in an example pair. On the right the deformed moving image after registration. It is clear that the fissures are relatively well aligned in this example, but the lung boundaries in the lower lungs are not. |
 |
| Figure 2: Evaluation of lung boundaries for the sample pair shown in figure 1. The fixed (target) image shown with its reference standard for lung boundary alignment as an overlay. The boundary segmentation is marked in blue. Regions within 2-20 mm of the boundary are marked in green and cyan according to whether they are inside or outside the boundary respectively. Voxels where the registration aligned voxels from opposite sides of the boundary are shown in red. |
Fissures are plate-like structures which divide the lungs into regions known as lobes. Since fissures represent important physical boundaries within the lungs we evaluate their registration individually. To simplify the evaluation, particularly for poor quality data where minor fissure structures may be difficult to see, we evaluate the registration of the major fissures only. Each lung contains a single major fissure dividing it into an upper and a lower section.
The fissures in all images are segmented using an automatic algorithm from van Rikxoort et al. [2]. Fissure segmentations are checked and altered manually to exclude minor fissures and any erroneous markings. Gaps in the segmentation may not be filled so the resulting segmentation may be incomplete but will not contain any non-fissure structures. A distance transform image is generated from the resulting fissure segmentation image.
Next, points within 20mm of the fissure segmentation are marked, excluding those within 2mm of the fissure to allow for minor inaccuracies in the segmentation. Points which are not directly above or below a fissure voxel (looking in the axial direction) are excluded in order to prevent the marked regions wrapping around the edges of the fissure plates. For each marked point p, the closest point p_fiss on the fissure segmentation is determined. Points above and below the fissure are distinguished by comparing the axial components of p and p_fiss. Different values, v_above and v_below are used to mark points above and below the fissure respectively. These markings constitute a reference standard for checking fissural alignment (see figure 3).
For each participant registration we receive the deformation field data. Using this data, we calculate for each point p_fixed marked with v_above or v_below in the fixed image which point p_reg in the moving image has been aligned with this location. If p_fixed is marked with v_above and p_reg is marked with v_below then a unit penalty is incurred. Similarly the reverse situation where p_fixed is marked with v_below and p_reg is marked with v_above also incurs a unit penalty.
For each registration of each scan pair the following statistics are calculated:
 |
| Figure 3: Evaluation of fissures for the sample pair shown in figure 1. The fixed (target) image shown with its reference standard for fissure alignment as an overlay. The fissure segmentation is marked in blue. Regions within 2-20 mm of the fissures are marked in green and cyan according to whether they are above or below the fissure respectively. Voxels where the registration aligned voxels from opposite sides of the fissure are shown in red. In this case alignment is very good except for a small region in the right lung (left of image). |
A well-distributed set of 100 distinctive landmark points has been defined in the fixed image from each scan pair (see figure 4). Each point p_fixed was then matched with the corresponding point p_moving in the moving image using a semi-automatic method. The methods for defining and matching the points are described in Murphy et. al [3]. The points are marked by at least 3 observers independently, and any location where the observer opinion differed by 3mm or more was checked a final time by an observer who could see all previous annotations on a single screen and accept or reject each one independently (see figure 5). The rejected points are not included in our reference standard, all other points are retained. By accepting more than one observer opinion as truth, we acknowledge that in most cases it is not possible to identify a matching point with perfect accuracy. This is related to many issues such as image quality, voxel size and the partial volume effect.
For each participant registration we receive the deformation field data. Using this data, we calculate for each of the defined points p_fixed in the fixed image which point p_reg in the moving image has been aligned with this location. The point p_reg is then compared (using Euclidean distance) with the reference standard point p_moving. Where several acceptable options for p_moving are defined, the p_moving that is closest to p_reg is used as the reference.
For each registration of each scan pair the following statistics are calculated over the corresponding points for that pair. (All distances are in mm):
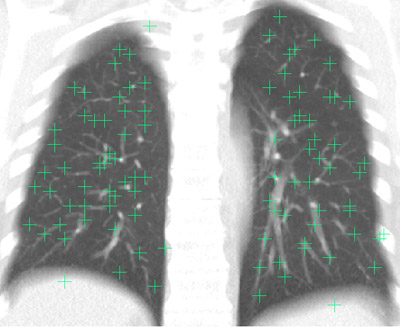 |
| Figure 4: A sample fixed image showing the well-distributed landmark points projected in the coronal direction. (An average intensity projection is used to help to demonstrate that all points are within the lung volume) |
 |
| Figure 5: A sample landmark point in the fixed image (top row), and the matching points selected by 4 independent observers in the moving image (rows 2-5). The columns show different views of the points from the three orthogonal directions. In this case the point was re-examined due to the differing opinions of observers (distance ? 3mm) and the point chosen by observer 4 was rejected as incorrect. |
The final category of evaluation is designed to analyse how physically plausible the registration deformation is. Some registration algorithms may appear to align visible structures very well, but in doing so may require physically impossible deformations. In particular we expect that a deformation should be bijective, i.e. define a one-to-one correspondence between points in the fixed image and points in the moving image. Regions where the deformation field is not bijective are commonly referred to as singularities (folding or tearing).
For each participant registration we receive the deformation field data. The determinant of the Jacobian of the deformation field, j, is calculated at every point. This specifies for each point whether local expansion or contraction has taken place. Where j \< 1 local contraction is implied, j = 1 implies no change and j > 1 implies local expansion (see figure 6). All points within the lung volume are checked and any location where j ? 0 is a singularity in the deformation field. For each such point a unit penalty is incurred. Points outside the lung volume are disregarded.
For each registration of each scan pair the following statistics are calculated:
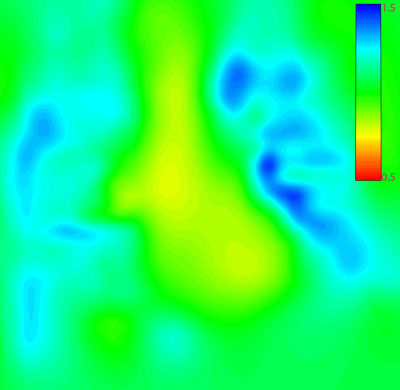 |
| Figure 6: The colour-coded Jacobian image for the sample registration shown in figure 1. In this sample registration no singularites occurred. The colour coding is restricted to values between 0.5 and 1.5 to show clearly that areas outside the lungs remained largely unchanged, within the lungs expansion occurred, and in the mediastinal region some contraction occurred. |
-
-
Alignment of the lung boundaries
- The percentage of checked points in the left lung for which penalties were incurred
- The percentage of checked points in the right lung for which penalties were incurred
- The percentage of checked points in the upper lung for which penalties were incurred
- The percentage of checked points in the lower lung for which penalties were incurred
- Score_boundary, The percentage of total checked points for which penalties occurred (This is the overall score in the lung boundary category)
- Alignment of the major fissures
- The percentage of checked points in the left lung for which penalties were incurred
- The percentage of checked points in the right lung for which penalties were incurred
- S_fissure, The percentage of total checked points for which penalties were incurred (This is the overall score in the fissure category)
- Correspondence of annotated point pairs
- Average distance in the Anterior-Posterior (AP) direction
- Average distance in the Superior-Inferior (SI) direction
- Average distance in the Left-Right (LR) direction
- Average distance in the upper lungs
- Average distance in the lower lungs
- Minimum distance
- Maximum distance
- Score_points, Average distance(This is the overall score in the landmarks category)
- Analysis of singularities in the deformation field
- The percentage of checked points in the left lung for which penalties were incurred
- The percentage of checked points in the right lung for which penalties were incurred
- The percentage of checked points in the upper lung for which penalties were incurred
- The percentage of checked points in the lower lung for which penalties were incurred
- Score_singularities, The percentage of total checked points for which penalties were incurred. (This is the overall score in the singularities category)
-
Scoring
When evaluation is complete each team receives a score which determines their placement. The scoring system is best understood by viewing the results table on the results page and clicking on a team name for further details. The basic structure of the scoring system is as follows:
-
A score (average error) is calculated for each scan pair in each category as described earlier on this page.
-
A ranking is calculated for each scan pair in each category based on the results of other teams for that scan pair and category.
-
The scores for all scan pairs are averaged in each category, giving a per-category score to each team.
-
The rankings for all scan pairs are averaged in each category giving a per-category ranking to each team.
-
An overall ranking is obtained by averaging the per-category rankings from each category.
-
The teams are placed in order of overall ranking.
More detailed information can be found on the scoring page
[1]"Automatic lung segmentation from thoracic CT scans using a hybrid approach with error detection." E.M. van Rikxoort, B. de Hoop, M.A. Viergever, M. Prokop, B. van Ginneken.
Medical Physics 36(7) (2009)
[2]"Supervised enhancement filters: application to fissure detection in chest CT scans." E.M. van Rikxoort, B. van Ginneken, M.A.J. Klik, M. Prokop.
IEEE Transactions on Medical Imaging 27(1), 1\9610 (2008)
[3]"Semi-Automatic Reference Standard Construction for Quantitative Evaluation of Lung CT Registration", K. Murphy, B. van Ginneken, J.P.W. Pluim, S. Klein, M. Staring.
MICCAI 2008: Proceedings of the 11th International Conference on Medical Image Computing and Computer-Assisted Intervention pp. 1006\961013.